Getting Warpage under Control

Download

Getting Warpage under Control

With Sigmasoft Virtual Molding, F. & G. Hachtel Manufactures Accurate Parts from the First Shot. “Think of it like this: the clip is bent when it leaves the machine, and you can see it straightening as it cools”, states Georg Schlöser. “And that is how we calculated it”, he adds satisfied, since he analyzed the required shrinkage allowance with Sigmasoft, so that the mold could deliver dimensionally true parts from the first shot.

Authors: Silke Allert, Vanessa Schwittay

First published in Kunststoffe international 12/2016, page 46-48
Georg Schlöser is responsible for simulation and process development at F. & G. Hachtel GmbH & Co. KG. The family-owned company is not only an injection molder with its own tool shop, but its engineering department also supports customers throughout part and mold development, for all the steps from the first idea down to the processing and analysis. The company’s aspiration is no less than to build molds that work straight away, and thereby instantly produce dimensionally true components.

To support this goal, the company offers a solid foundation of experience achieved by over 600 built molds of all possible types. At the same time, Hachtel applies state-of-the-art technologies. There are good reasons why the company’s mission statement is “we understand technology”. To achieve the ambitious production goals, employees must first understand all the processes relevant to part production, and be able to optimize them. This is made possible through process simulation: it allows the production process to be realistically modelled and a profound process understanding to be gained at the design stage. The necessary measures to achieve process optimization can therefore be taken at an early stage.

The value of this approach is tested at the end of the development process with non-destructive validation of the parts by means of computer tomography (CT). On the five machines that the company now owns, the specialists gain a true insight. This is paying off.

 (c) SIGMA Engineering GmbH

Fig. 1. The clip fixes a basket on a slide. For assembly, dimensional accuracy is imperative

Warpage is to Be Expected, …

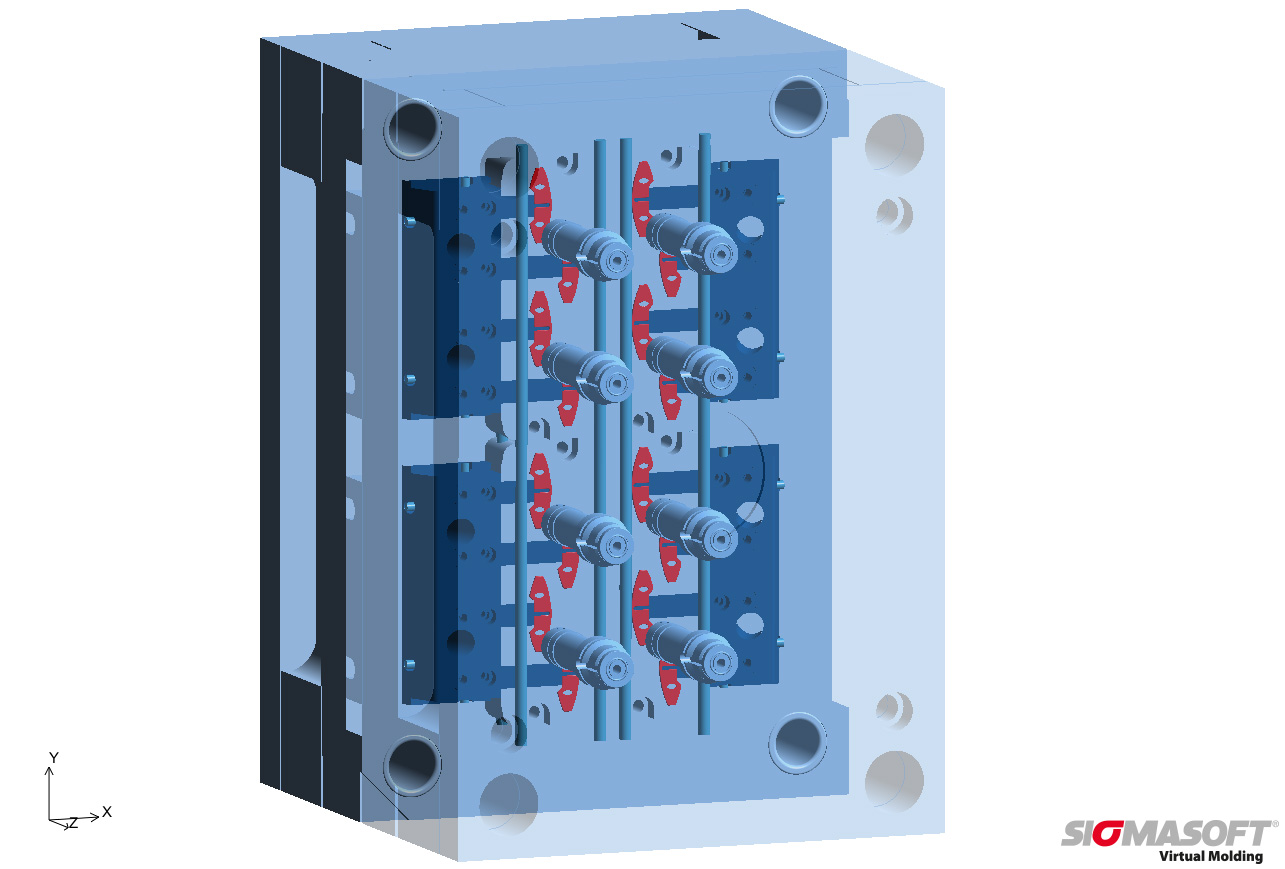
…. for example, during the production of the clip (Fig. 1), which fixes a basket on a guide rail. To ensure problem-free assembly, the dimensions have to be kept within strict tolerances. The clips are to be produced from a talc-filled polypropylene with high rigidity and dimensional stability in a 16-cavity hot runner mold. The required core slides complicate the mold cooling (Fig. 2). The geometry of the part, however, gives reason to expect a significant warpage. If time-consuming iterations of the mold and trial-and-error during start-up are to be avoided, it is necessary to use a simulation tool, to realistically reproduce the injection molding process and to optimize the mold even before the tooling.

Hachtel decided in favor of Sigmasoft Virtual Molding. And for a good reason: the Sigmasoft simulation software considers not only the part geometry, but also each of the mold components and the complete production cycle, including all non-productive times. “For us, Virtual Molding does not just mean simulating mold filling, since simplified modeling of the mold is usually not enough to predict the temperature distribution within the part and the resulting warpage”, explains Timo Gebauer, Chief Technical Officer of Sigma Engineering GmbH.

“This is why we calculate temperatures in the complete mold. In the analysis, we include all process steps that have an influence on the heat balance in the mold and therefore affect the part temperature. This is done over a time frame of several production cycles, which also consider the heat up stage or process interruptions”.

To determine the temperature distribution in the mold as accurately as possible, the flow of the heat-exchange medium in the cooling channels can additionally be computed, since the local heat removal depends on the flow behavior in the channel and on its geometry. In complex cooling systems this has a significant effect on the mold temperatures, which should be taken into account.

 (c) SIGMA Engineering GmbH

Fig. 2. The hot-runner manifold and the slides influence the mold cooling and must therefore be considered in the simulation

Mold Hotspots Are Not Identified in Filling Simulation

For the clip this means in practice that both the 60-minute heat-up and the warming up of the mold over several cycles were simulated. Because only when the mold has reached thermal equilibrium the boundary conditions for virtual production are exactly the same as those found on the machine during series production. During settling to equilibrium, the opening and closing of the mold, movement of the sliding cores and heat loss through the parting line are reproduced realistically. The hot runner manifold is also fully taken into account, as it introduces a significant amount of heat into the mold.

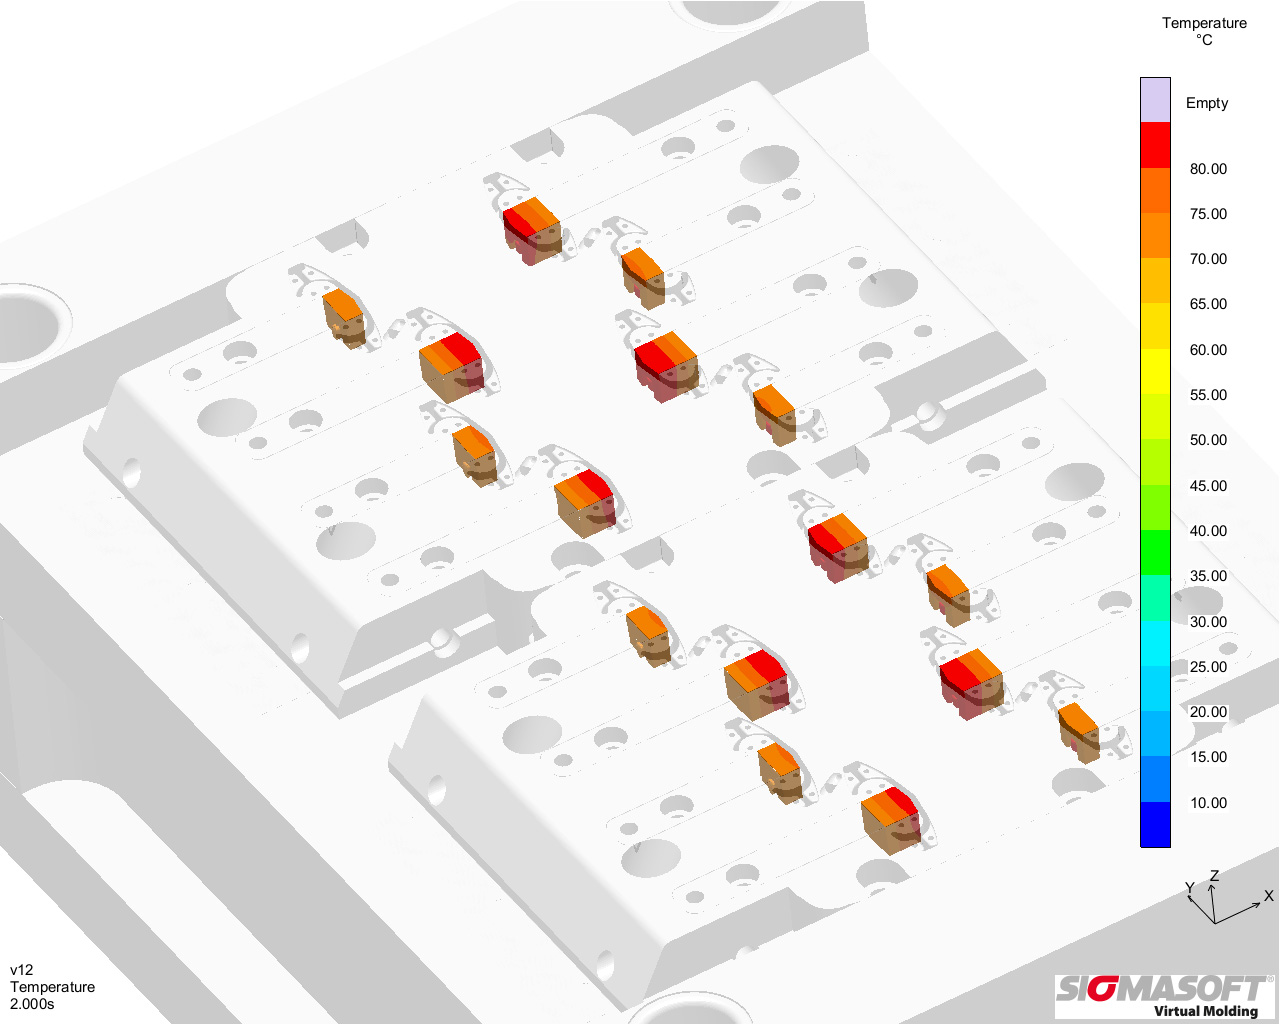
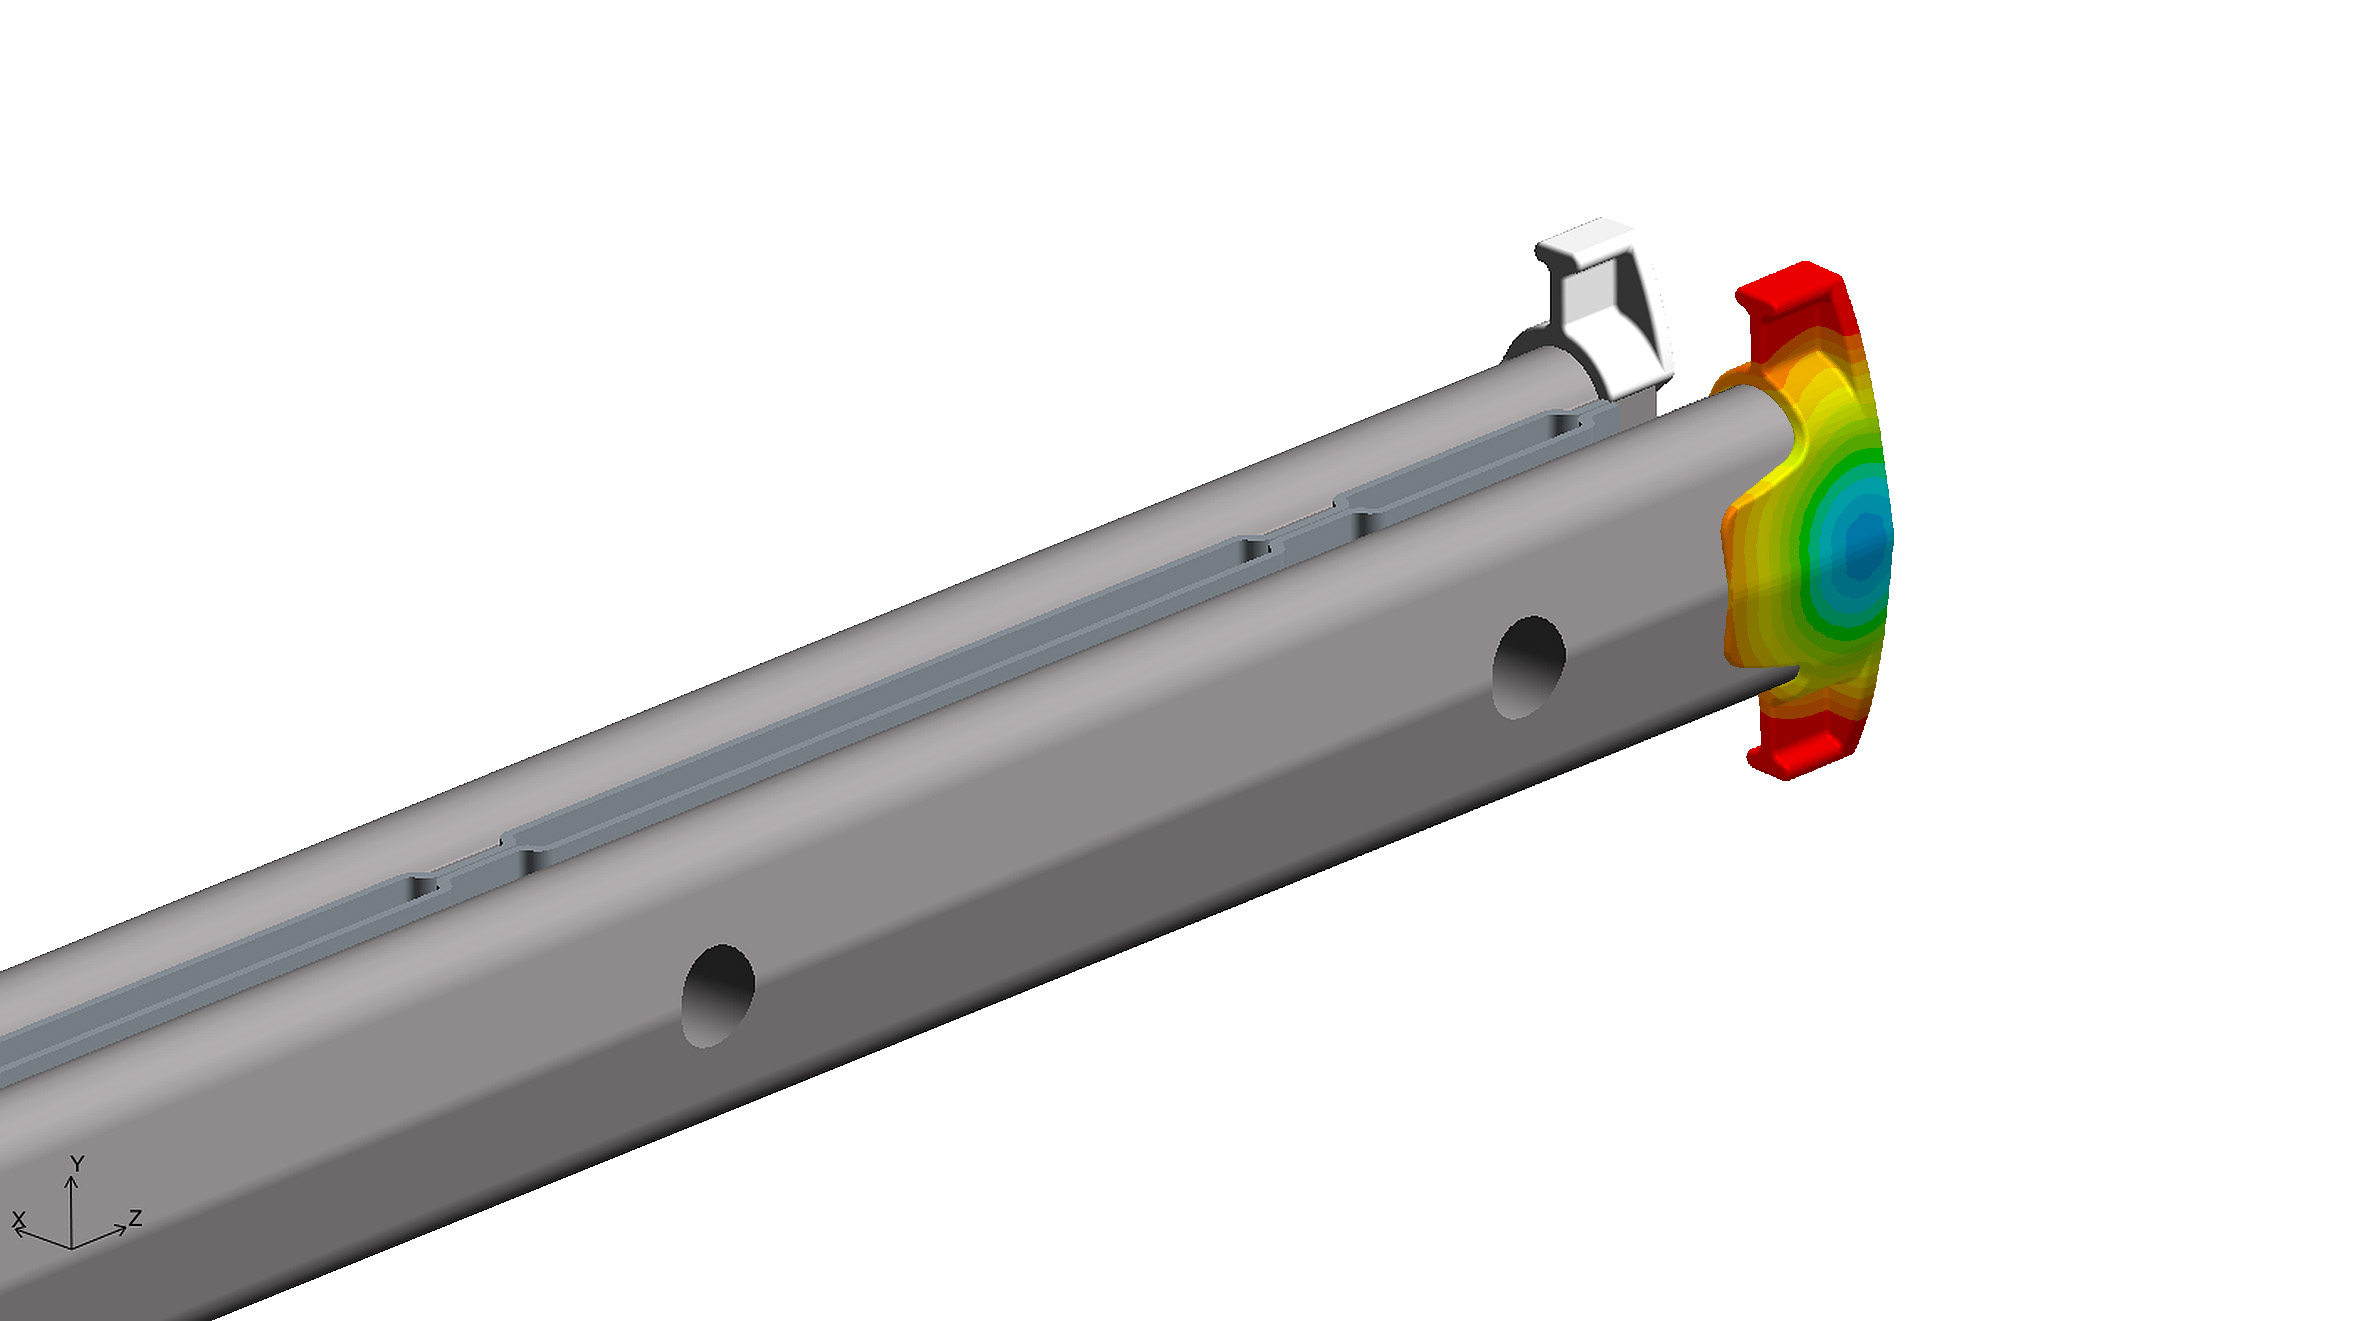
On this basis, the filling process, i.e. the propagation of the flow front in the cavity, is calculated in detail during the last simulated cycle. This calculation therefore relies on a realistic distribution of local mold temperatures and not on the assumption of a homogeneous temperature in the cavity. This analysis demonstrated that the planned mold cooling was not sufficient. The cores heated up from cycle to cycle, so that the local temperatures reached values of over 70°C, while the set temperature was 20°C (Fig. 3).

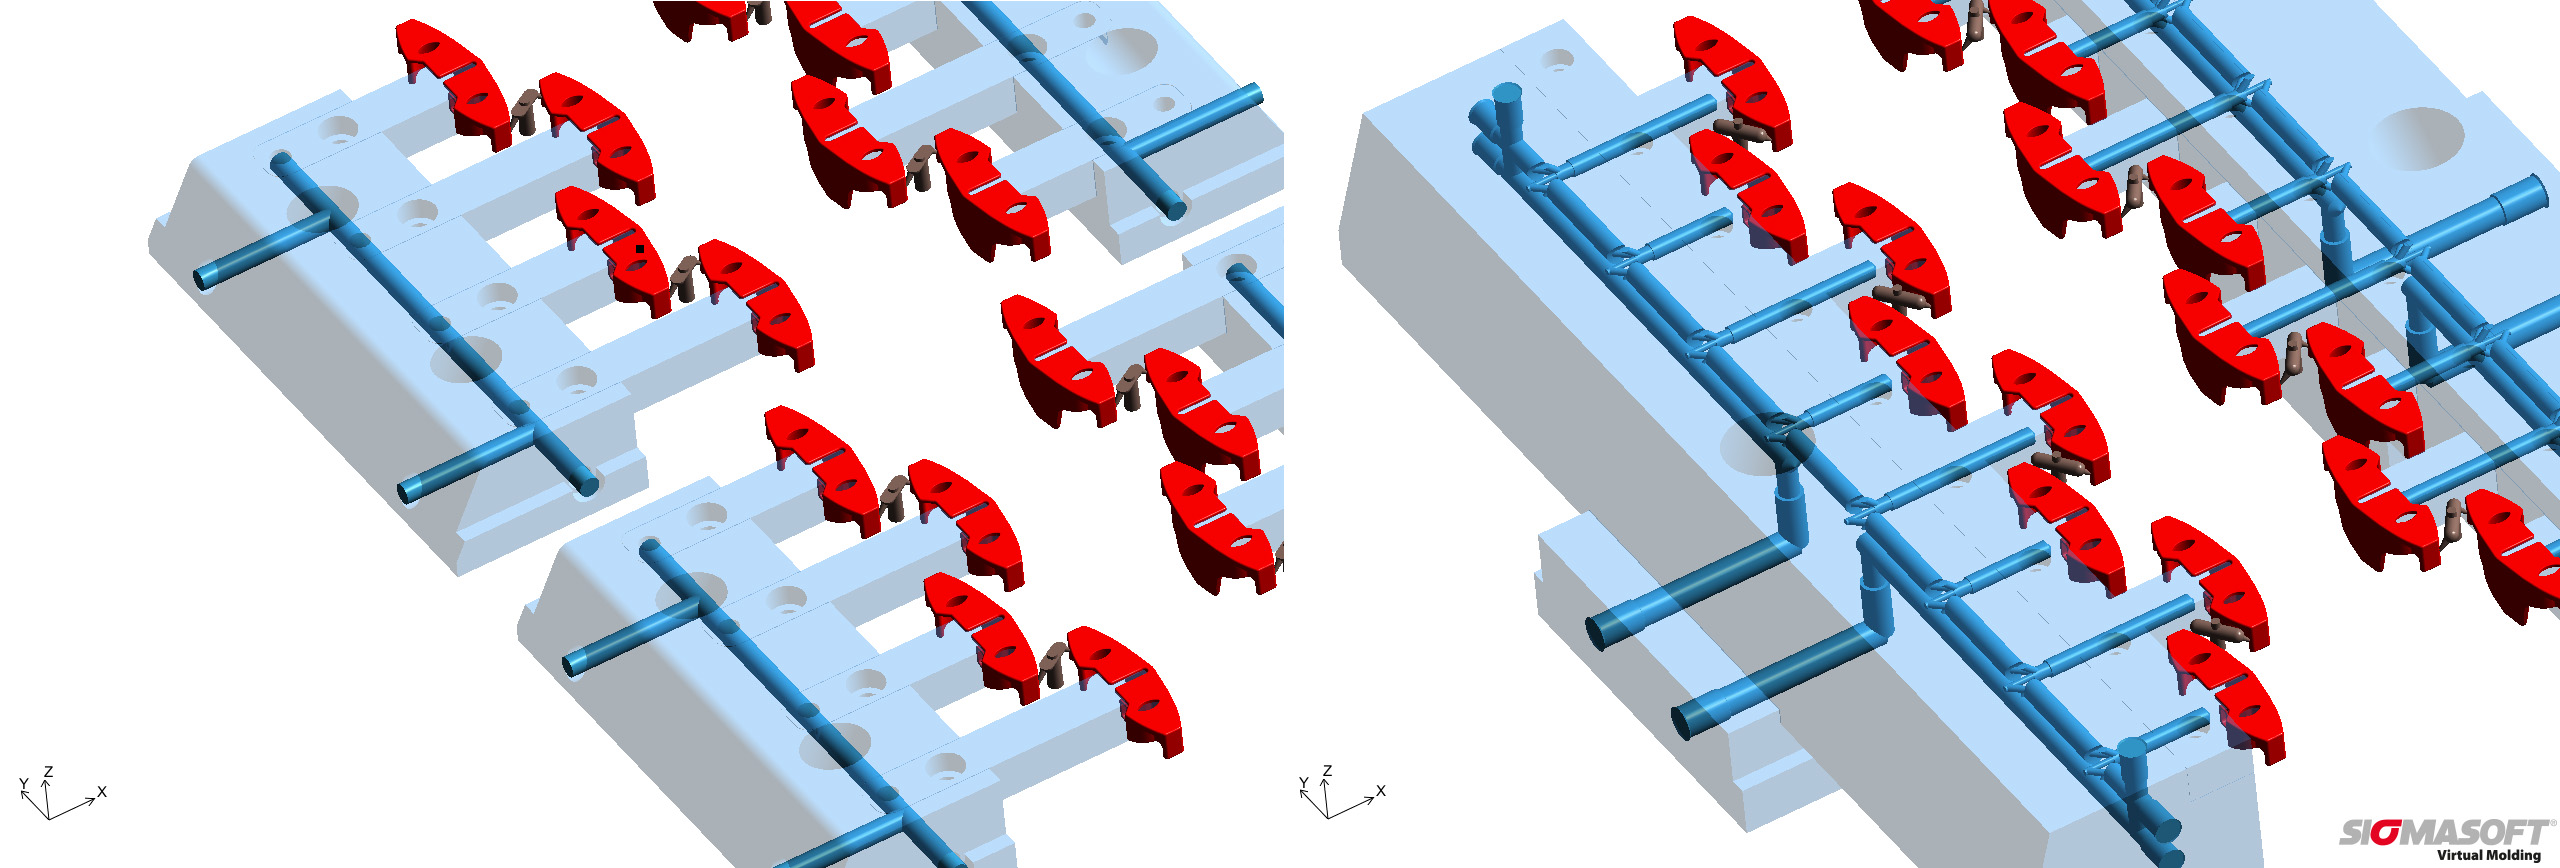
It is clear that such mold hotspots negatively affect the cycle times. And it is also clear that these weak spots in the cooling could not be found with a simple filling simulation. On the basis of the results of this first simulation the cooling concept was optimized. The two cores at one side were grouped together and it was then possible to cool them more intensively by means of bubblers (Fig. 4). In this way, it is possible to achieve a far more homogeneous mold temperature distribution (Fig. 5). Temperatures are now consistently below 58°C. With the new cooling concept it is possible to shorten the cycle time significantly. But not only this: it also improves the dimensional accuracy of the part.

 (c) SIGMA Engineering GmbH

Fig. 3. Hotspots form in the slide cores with temperatures over 70°C

 (c) SIGMA Engineering GmbH

Fig. 4. Comparison of cooling concepts: left the originally planned slides and cooling channels, right the optimized design with bubblers

Reliably Calculating the Necessary Shrinkage Allowance

With Sigmasoft it is possible to calculate the part warpage, and again the principle of virtual injection molding pays off: in the calculation of the local material shrinkage, the realistic temperature distribution in the mold and the cooling history of the part are considered. The warpage simulation covers both the constrained cooling in the mold cavity, as well as the free cooling after the part is ejected.

One can learn from this “cooling history”. For example, the fact that it is necessary to produce a bent clip, so that the clip has the required dimensions after cooling is finished. “We can work with the result,” says Georg Schlöser. “For the clip we determined the necessary shrinkage allowance for the mold using the warpage simulation. This way we manufactured parts with the required quality right from the first shot”. The final CT analysis of the first parts confirmed the simulation. Consequently, Hachtel saved expensive and time-consuming iterations to adjust the cavity geometry.

 (c) SIGMA Engineering GmbH

Fig. 5. Comparison of temperature distributions: left the original concept with conspicuous hotspots on the slide cores, right the homogeneous temperature in the optimized design

Summary

The virtual modeling of the injection molding process with Sigmasoft Virtual Molding provides realistic temperatures in the part and mold. Based on these results it is possible to reliably predict the part deformation. The test rig is therefore transferred to the desktop. This helps in all stages of the part and process development to avoid mistakes and to save resources, because iterations can be performed within a matter of hours on the computer. With this approach, Hachtel was able to produce an optimized mold for the clip, in which dimensionally accurate parts were produced under an optimized cycle time from the first shot.

 (c) SIGMA Engineering GmbH

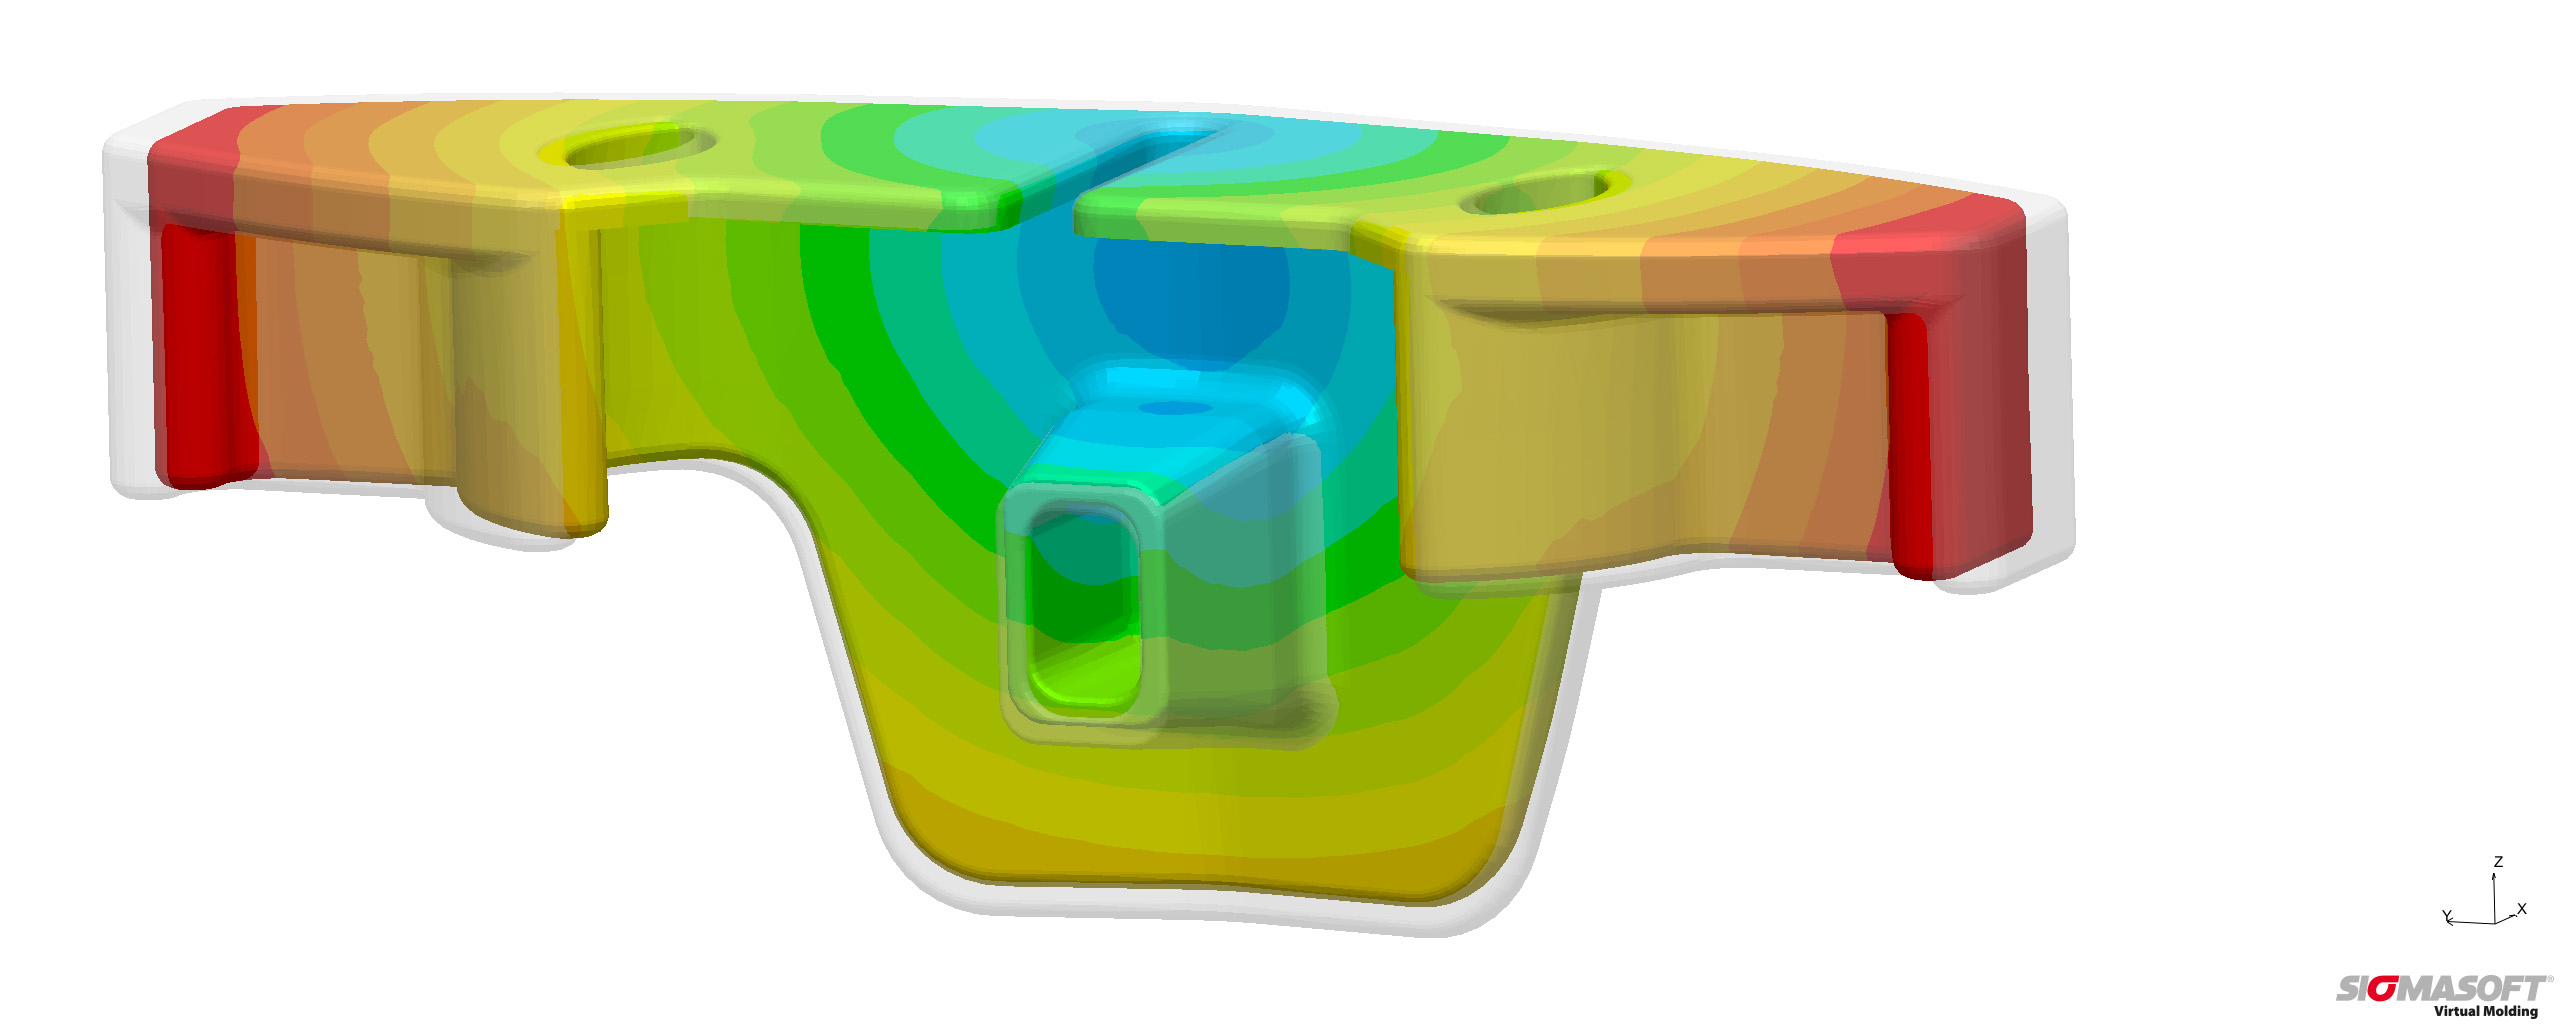
Fig. 6. The part geometry tends to undergo warpage (non-warped geometry shown transparent). Sigmasoft allows this problem to be mastered

Pressure prediction in elastomer molds

Download

Pressure prediction in elastomer molds

In spite of ongoing development of existing simulation models it happens that the simulation results do not always match the measurements taken at the actual machine. An erroneous simulated pressure in the elastomer mold may critically affect other simulation results such as the predicted filling behavior of the form, the mechanical properties of the component, or warpage of the finished part, as correlations between pressure changes and related temperature development exist. Errors in the predicted values could lead to serious problems in the serial production. The article gives a brief introduction to the measurement and simulation of pressure and answers various questions.

Authors: Timo Gebauer, Vanessa Schwittay

First published in RFP 02/2016, page 48-50

The process simulation SIGMASOFT® Virtual Molding is already a well-established tool in the development phase of elastomer products. It is used to prevent problems in the production and to shorten the time to market in industrial applications. Already very early in the development phase runner systems can be balanced or mold temperatures optimized. In spite of ongoing development and increasing complexity of the models it happens that the simulation results do not match the measurements at the machine.

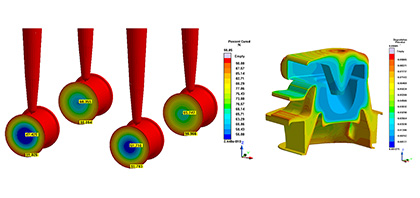
This does not only concern the simulated pressure, but also further results as the filling behavior and many temperature related results because of their correlation with pressure changes. Thus it becomes not only more difficult to decide whether the part fills as predicted, but also results as curing degree, mechanical properties of the part, material degradation or warpage of the part may become less reliable (Picture 1).

Picture 1 – Various results depend on the correct pressure prediction as curing degree (left) and material degradation (right)

If the phenomena observed at the machine during serial production are not the same as the predicted values, major problems can occur. Lost money, time delay and frustrated customers are some of the consequences. The question now is why something like this happens and even more important how one can avoid problems like this.

One of the key values during mold design is the pressure needed to fill the cavity. The maximum pressure is one of the limiting factors for the machine selection. It is also an indicator for the energy that heats up the elastomer during filling and is therefore critical for the curing time prediction.

Pressure can be measured at various positions in the system. Hydraulic pressure, pressure sensors in the piston or the mold are most common references for the pressure. Usually only one reference is used. If the system offers more than one measured pressure, the values are often already contradictory.

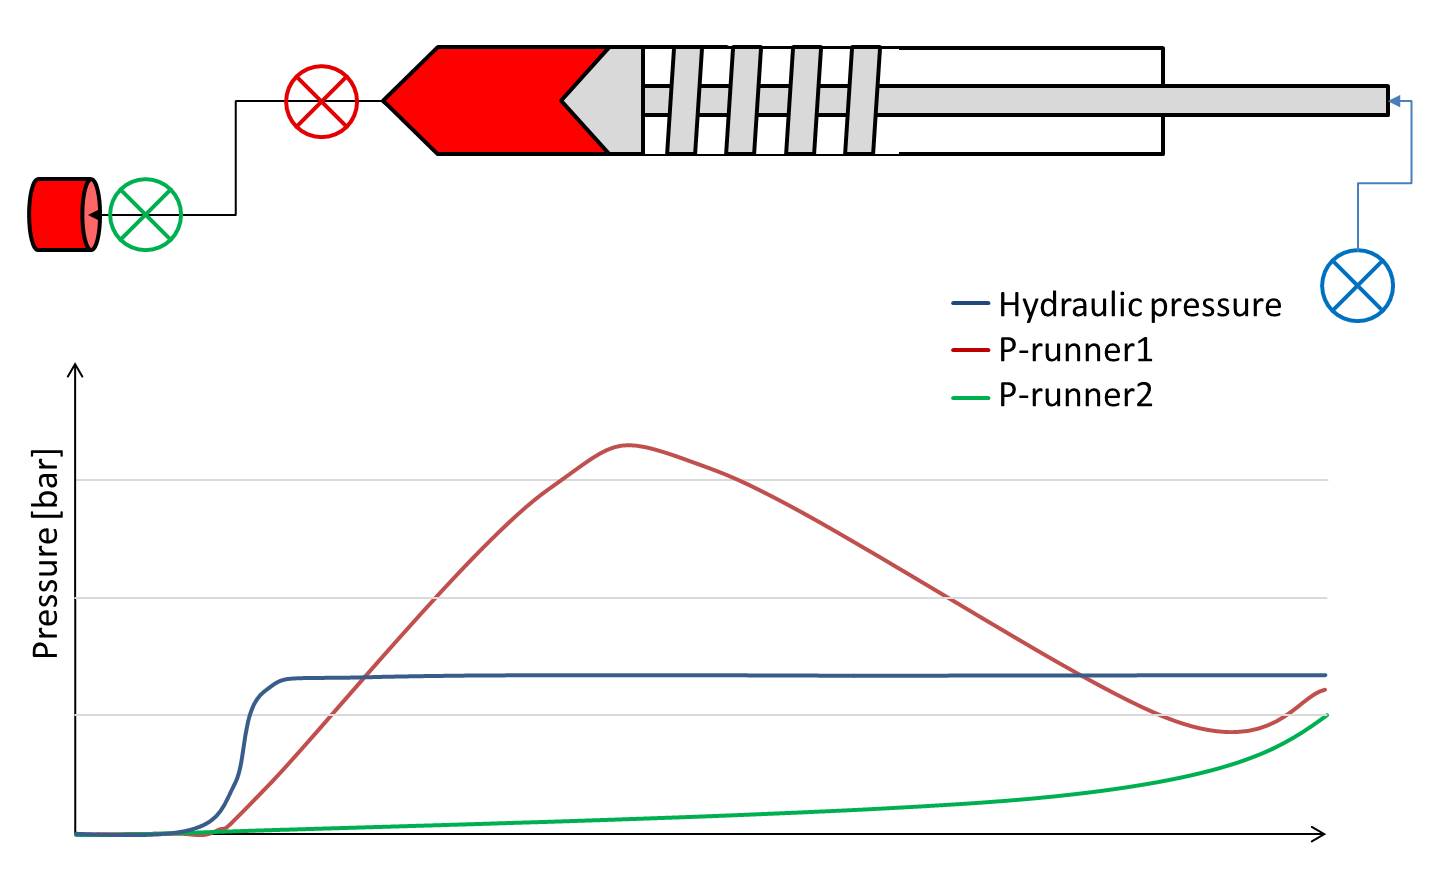
Picture 2 shows the measured pressure at two different points in the gating system of an elastomer mold. Even though the hydraulic pressure is constant, the pressure close to the machine (P-runner1) decreases at a certain point. On the first view it looks unphysical. What happened in this case is that the hydraulic pressure also sees what happens in the piston. If the melt cushion becomes too small, the flow behavior in this area can dramatically increase the hydraulic pressure.

Picture 2 – Hydraulic pressure and two pressure curves close to the gate (P-runner2) and close to the machine (P-runner2)

In the simulation the pressure can be predicted at various positions as well. In addition the simulation is usually based on different models and ideal boundary conditions. Due to the selected model and the assumptions for the process simulation results can vary. These variations are based on the complex interaction between material measuring errors, modeling and assumptions. Therefore the results are often hard to judge.

One of the critical values for the prediction of the pressure is the viscosity depending on shear rate and temperature. Unfortunately there is no way to directly measure the viscosity. Depending on the system that is used, pressure or momentum are measured at specific conditions of flow. Based on these values and several corrections, the viscosity can be calculated. Since the setup of these systems is very sensitive the results can vary in a wide range. Especially for elastomer mixtures these scatter of measured viscosity can be more than 100%. 

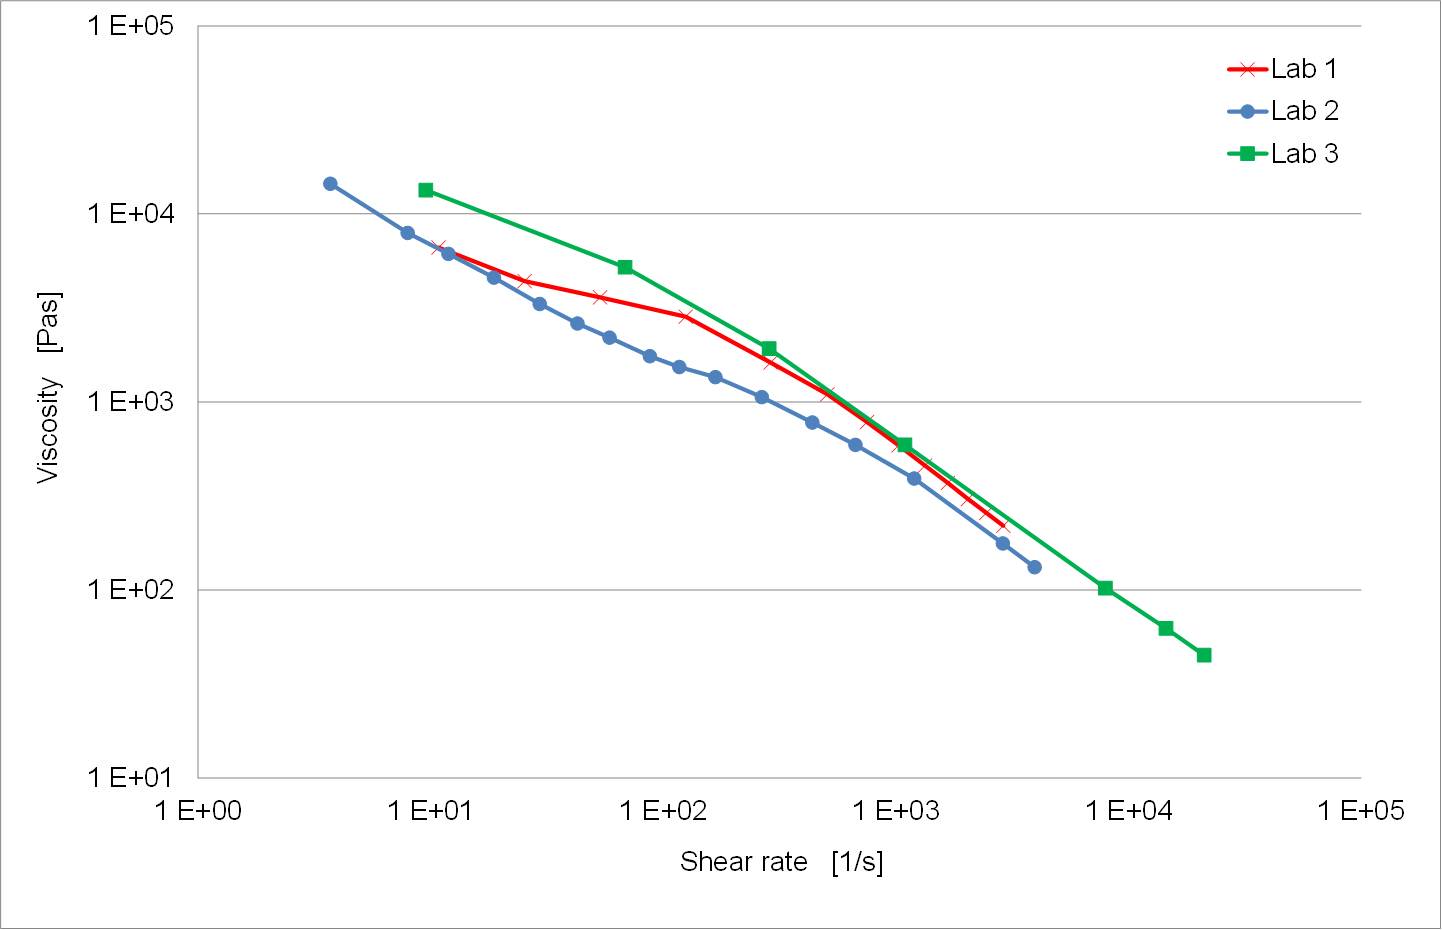
Picture 3 shows the result of three different measurements for one mixture (one batch), measured at three different laboratories. The diagram is plotted in logarithm scale. The viscosity measured at laboratory three is 5 times higher than the viscosity measured at laboratory 2. If these viscosities are used in a simulation, the predicted pressure will be completely different for the three measurements.

Picture 3 – Viscosity measured at three different laboratories.

One reason for these differences is the sensitivity of high pressure viscometers. Depending on how the elastomer is placed in the machine and depending on the setup of the system the measured results can vary a lot.

Other effects are the various corrections which can be used to calculate the true viscosity (Weissenberg-Rabinowitsch, Mooney, Bagley). These corrections usually need a more complex setup or different experiments. Since every experiment has to be paid, not all of the corrections are done in every characterization.

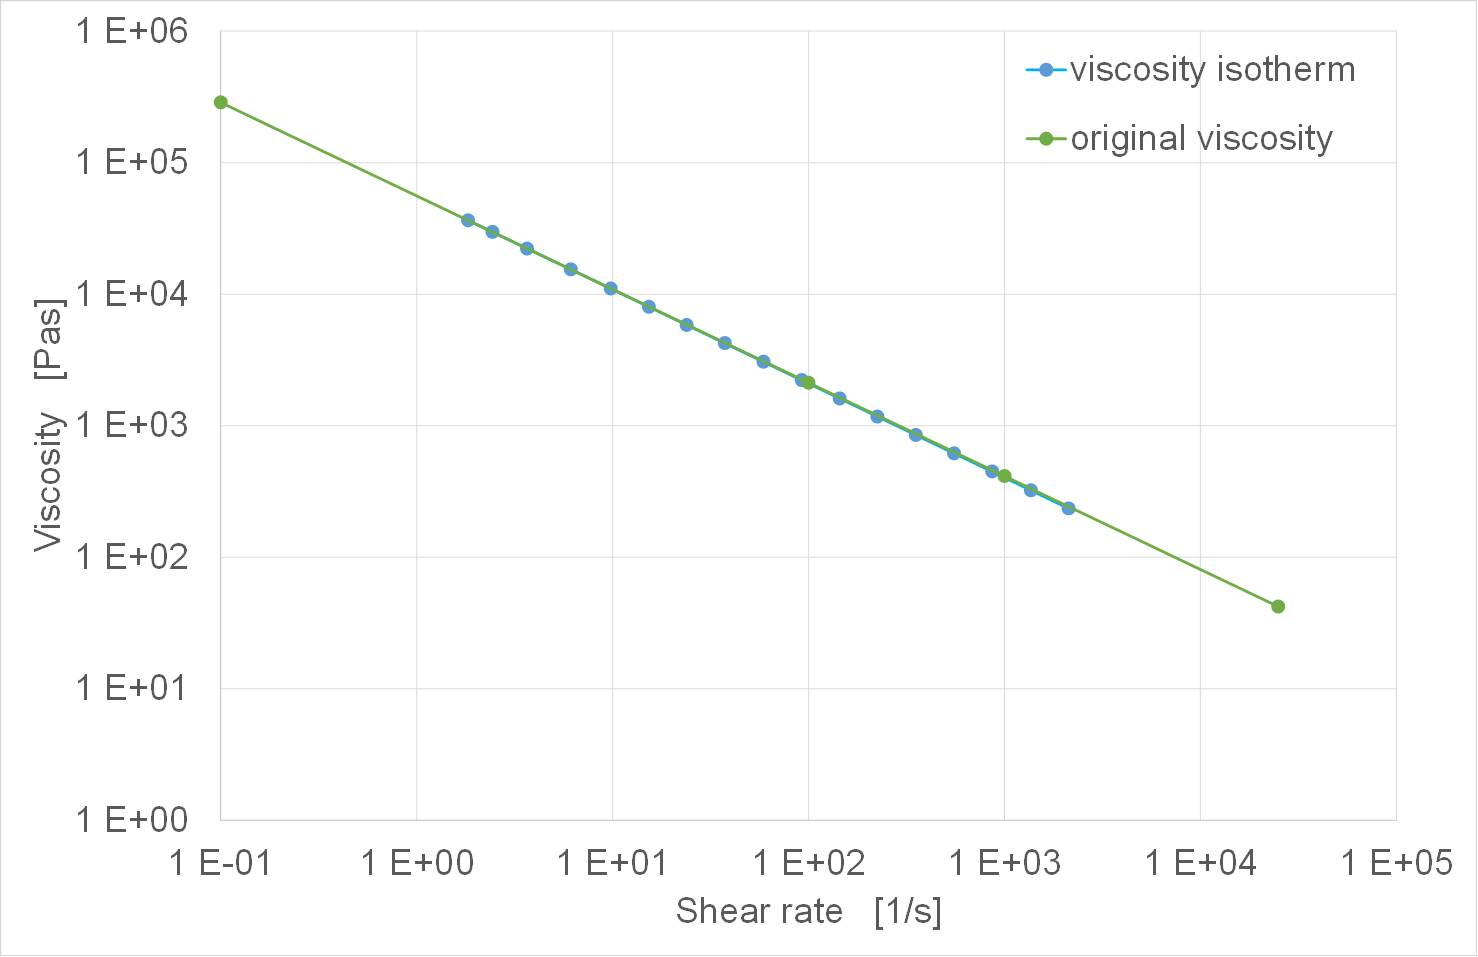
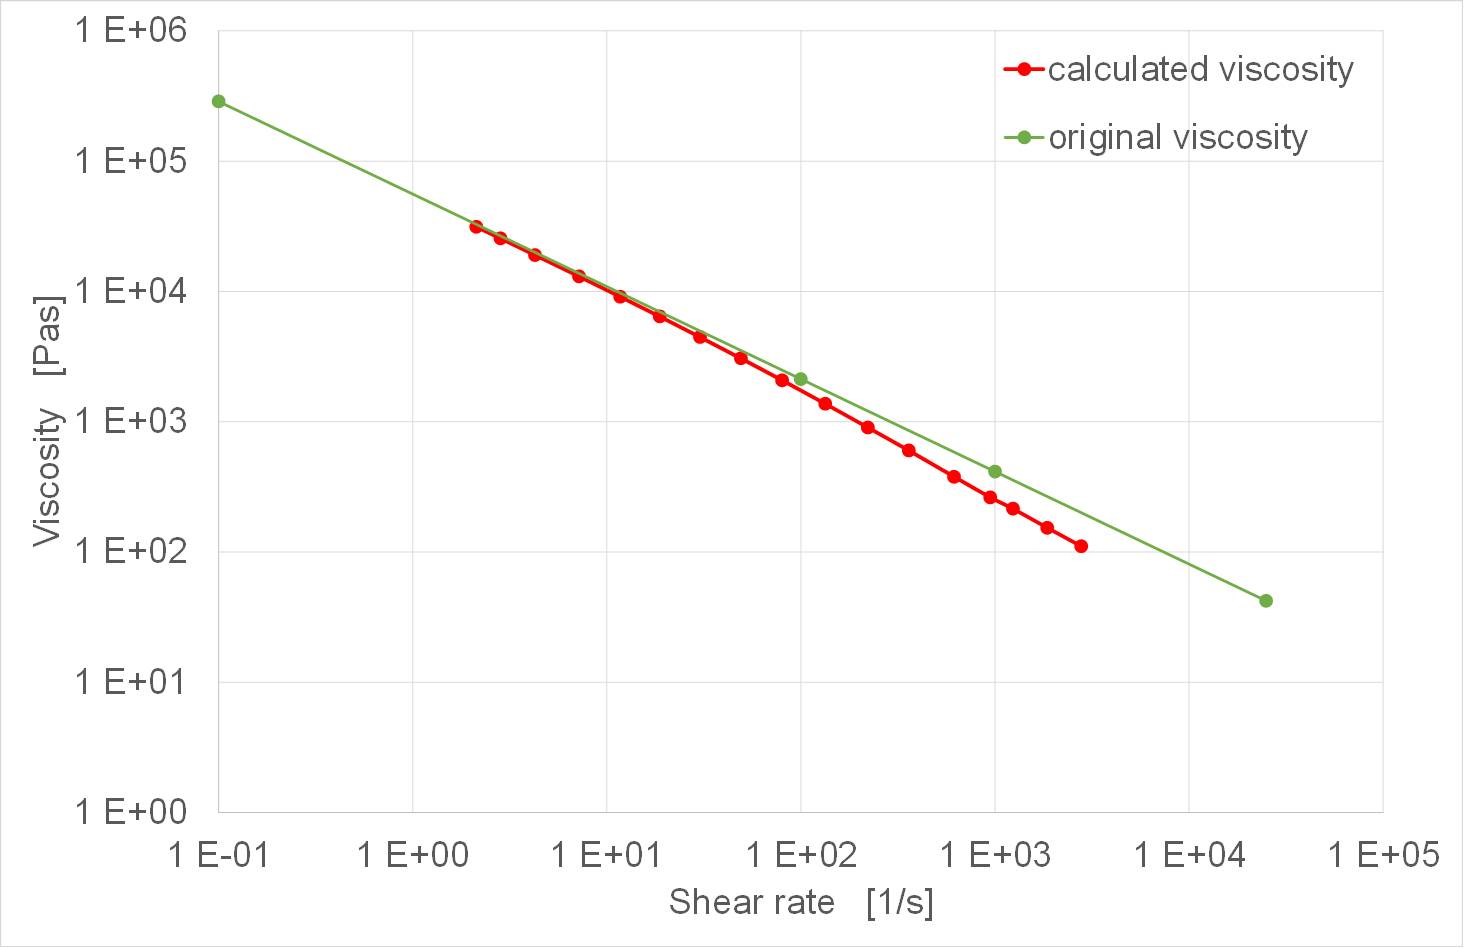
In addition to the already complex problem of known corrections, there is no correction taking into account the temperature increase during the measurement. The material is pushed through a capillary with a high pressure. The higher pressure and velocity are the higher the shear heating will be. Depending on the sensitivity of the viscosity for temperature changes the real viscosity will be a lot higher than the measured viscosity. Picture 4 shows a virtual experiment. In this experiment a material with a certain viscosity (original viscosity) is used to simulate a high pressure capillary viscometer. The simulated pressure is used to calculate the viscosity as it is done in the real experiment. The second curve (viscosity isotherm) shows the calculated viscosity based on this experiment. The material used to generate the viscosity was modified in the simulation in a way that the temperature couldn’t increase. One can see that both curves match pretty good. This proof of concept shows that the simulation of the capillary works very accurate and gives the correct pressure prediction.

Picture 4 – Original viscosity and calculated viscosity for an isothermal material behavior

A second simulation was performed. In this simulation the material was allowed to change the temperature due to shear heating. Again the viscosity was calculated. Picture 5 shows the original viscosity (green curve) and the calculated viscosity (red curve) for this material. In the region of low shear rates the two curves match very well. In these areas the shear heating is rather low so the material does not heat up too much. In the region of higher shear rates the distance between the two curves become bigger. At the shear rate of 1000/s the difference between the two curves is approximately a factor of two. This simple experiment shows the dramatic influence of the temperature increase during the viscosity measurement. To predict the pressure loss in an elastomer mold it is necessary to also correct this behavior.

One way to get the real viscosities is a simulation. SIGMASOFT® Virtual Molding can be used to find the real viscosity taking the temperature increase into account.

This short introduction in measuring and simulating pressure shows that that there are various questions that have to be answered in detail before the simulation result will match the measured pressure. It is not always necessary to answer all of these questions but it is important to be aware of the influence of certain effects. This will make sure that critical values can be avoided in the production.

Picture 5 – Original viscosity and calculated viscosity for a normal material behavior